Two weeks ago we looked at rain and last week at blooms. Both of those are questions about the coming winter and spring. This week is about what the ocean along the coast is already showing: warm water, high water, and the marine heatwaves that kept returning near Tomales and Morro Bays all summer and into the fall.
What this means for your farm. The ocean along the coast is running warm and high. Southern California’s coastal water had its second-warmest September since 1981, heatwaves were still going in the water off Morro and Tomales Bays on October 20th, and sea level from San Francisco south was above September 1997 (KNOWN · measured; water temperature by satellite offshore, sea level not corrected for air pressure). How much of that is El Niño, our data cannot say. If the water stays high, low shores and estuaries will meet this winter’s king tides and storms from a higher line. For Vibrio, the water to watch is in your growing area next summer.
The hypothesis
El Niño’s warmth reaches the West Coast through the ocean itself, lifting sea level and warming coastal water, and the heat-linked risks for shellfish, such as Vibrio, follow.
Meet the Kelvin wave
You can’t see a Kelvin wave from a boat, and it never breaks on a beach. It is a broad, slow bulge in the ocean that travels east along the equator, raising sea level and thickening the warm surface layer (NOAA). What travels is the bulge, not the water itself. A burst of westerly wind over the western Pacific usually sets one off, and it takes about two to three months to cross the ocean. At South America the wave splits: about half heads south, and the other half turns north, hugging the coast of Mexico and California.
Where it passes, sea level rises and the warm layer thickens, so the winds that usually lift cold, nutrient-rich water to the surface bring up warmer, nutrient-poor water instead (Jacox and colleagues, 2015 and 2017). The coastal wave matters most off Southern California; up to Cape Mendocino it shares the work with local winds, and farther north the winds take over in setting the water temperature (Jacox and colleagues, 2017). As of its October 19th update, NOAA’s Climate Prediction Center counts four warm Kelvin waves set off since last December. The trip along the coast to central California takes one to six months (Jacox and colleagues, 2015), so the earliest of them have had time to arrive, and Dillon Amaya, who tracks these coastal waves online, reports that strong ones have already been observed as far north as Washington.
A tide gauge’s monthly average cannot single the waves out: it includes everything that lifts the sea. From San Francisco south, monthly sea level ran about 5 to 7 inches (12 to 17 cm) above normal in September (KNOWN · measured, not corrected for air pressure; more below), and how much of that the Kelvin waves brought, our monthly data cannot say. A few inches sounds small beside the daily tide, but a higher sea level lifts every high tide, on average. If the water stays high, this winter’s king tides, storm surges and swollen rivers will all start from a higher line, and that is when low shores and estuaries are most likely to flood.
How El Niño reaches the coast by sea
Part of El Niño’s influence on our coast travels through the atmosphere, as shifted winds and storm tracks. Part travels through the ocean, as these Kelvin waves, and tide gauges from San Diego to Washington record the rise, though north of San Francisco the winds add more of it.
Our own analysis found that link in the historical record. At all 19 tide gauges we examined, coastal sea level tracked warming in the eastern tropical Pacific most closely at a lag of 0 to 2 months, and along the 17 open-coast gauges a sustained 1 °C of tropical warming went with about 3 to 6 cm of higher sea level (INFERRED · supported, as a physical pathway; descriptive).
That makes the tide gauges one of the more direct ways to watch El Niño along the coast, especially south of San Francisco.
High water
We compare with 1997 because, of the strong El Niños since 1950, only 1997 and 2015 saw sea level at the coast rise as early in the year as this one, and 1997’s August ran higher than 2015’s at all seven gauges we compared (KNOWN · measured, not corrected for air pressure).
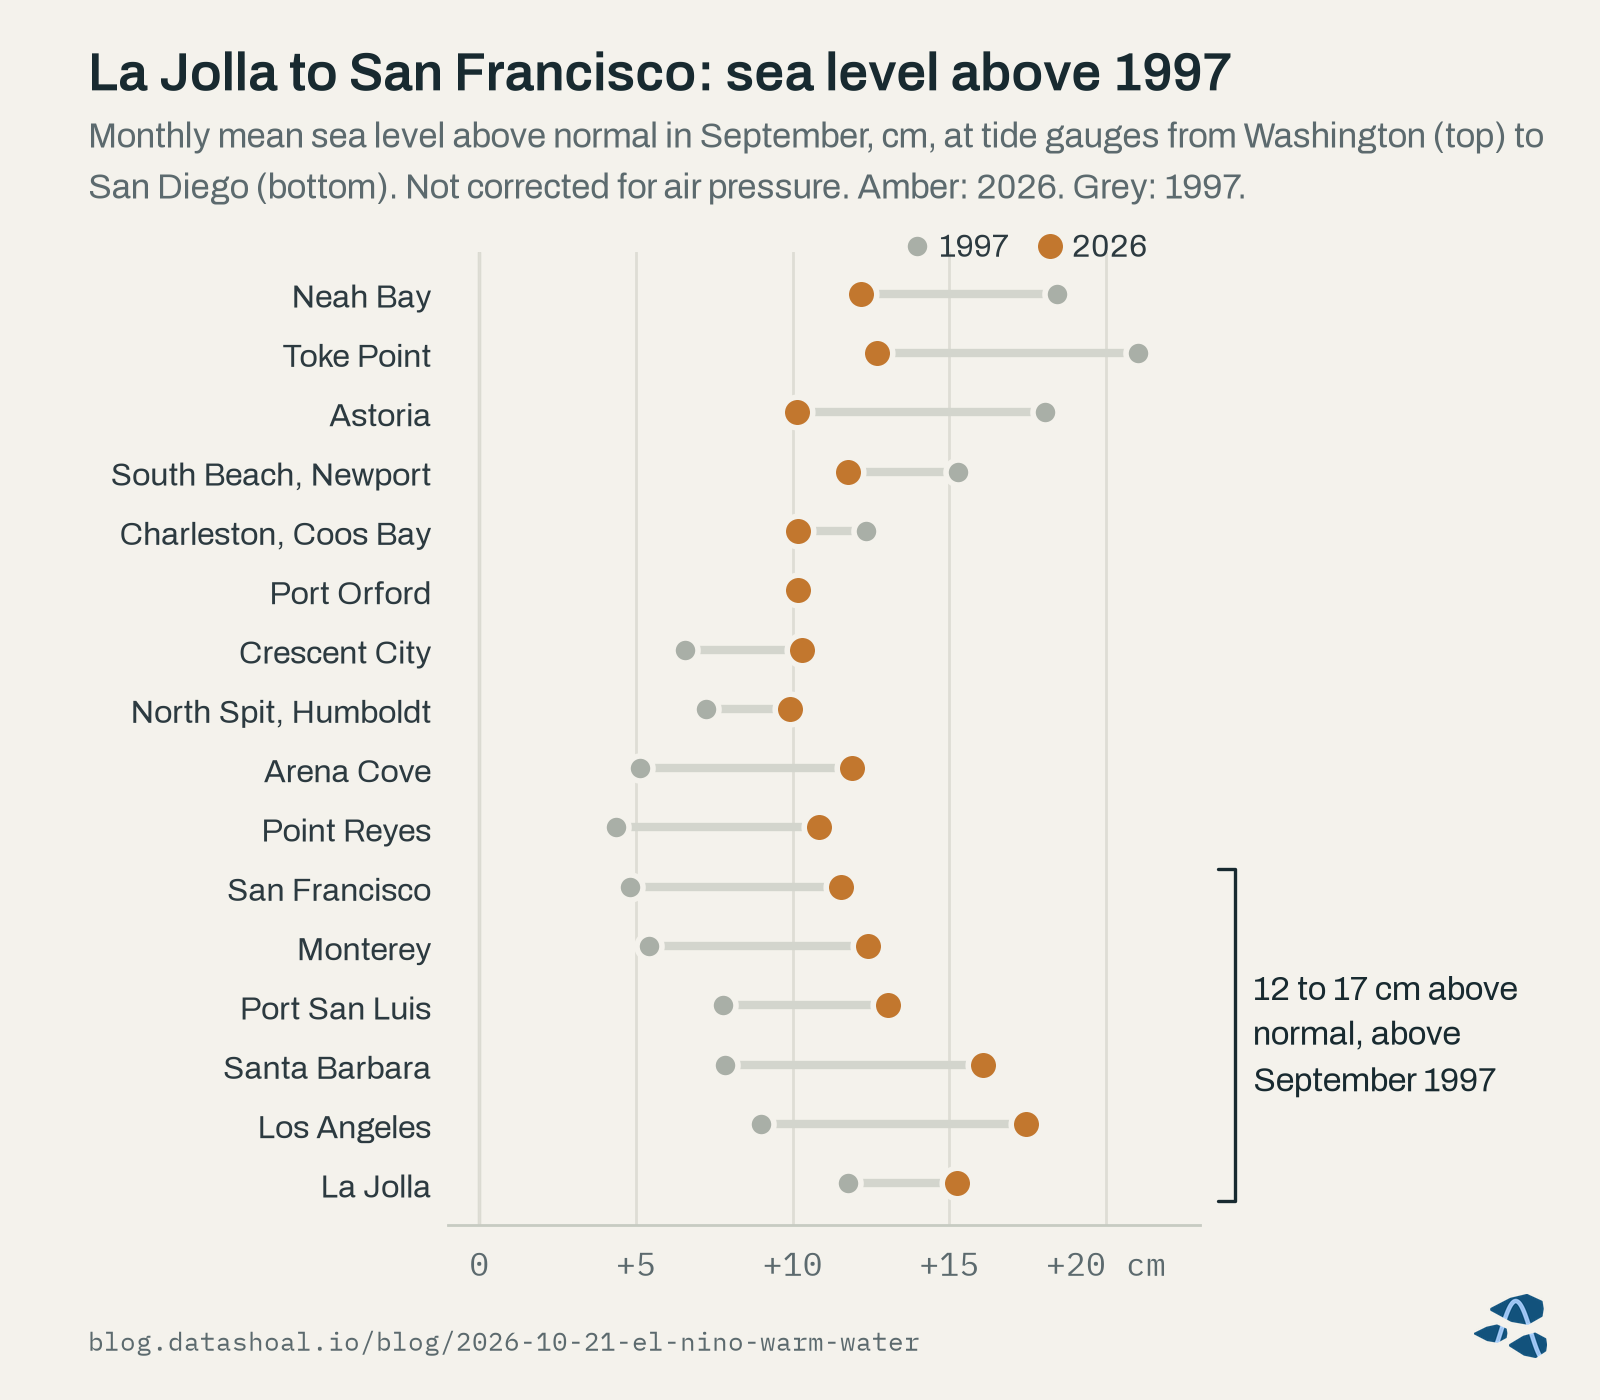
In August 2026, monthly sea level from La Jolla to San Francisco was 8-11 cm above normal, similar to or above August 1997.
KNOWN · measured, not corrected for air pressure.
September, now published at every gauge, went higher still: from San Francisco to La Jolla it ran 12 to 17 cm above normal, above September 1997 at all six gauges (KNOWN · measured, not corrected for air pressure). These are monthly averages, measured against each gauge’s long-term trend and usual seasonal swing; single days, compared with the tide tables, can run much higher. The chart also shows the rest of the coast. From Coos Bay north, this September sat 2 to 8 cm below September 1997 (KNOWN · measured, not corrected for air pressure). We have not worked out why the two years differ in the north, and we are not attributing either pattern to El Niño here. The air-pressure caveat matters: low atmospheric pressure alone can lift sea level by a few centimeters in a monthly average, and more during a storm, and we have not yet been able to apply that correction to the months since February.
We also tried a simple sea-level indicator. A sea-level rule tuned after the fact on 7 past strong El Niños (checked on 2) has fired since July 2026 (KNOWN · case study). It is not an early warning of El Niño itself: the tropical index runs ahead of it by a median of about five months. In July it cleared its line by only 1.3 to 2.6 cm, and it does not fire at all when sea level is measured against the trend of the last 30 years instead of the full record. We will check it against this winter rather than lean on it.
Starting from August’s level, the latest month when we ran this projection, and adding each past strong event’s later rise, 4 past strong events would put January 2027 at 5.1 to 22.5 cm above normal at La Jolla and 9.9 to 28.5 cm at San Francisco (INFERRED · case study, 4 events, 3 at San Francisco; not corrected for air pressure). The range is wide because the events were different, and we quote it only as a range.
Warm water
The animated map at the top of this post steps through the last twelve months of coastal water temperature compared with normal.
Coastal water off Southern California had its warmest August since 1982 (+2.8 °C above the 1991-2020 normal) and has been warmer than normal every month since September 2025, while Oregon’s coastal water was cooler than normal in August. How much of the August record is early El Niño influence, and how much is the warmth that began during the 2025-26 La Niña, has not been determined.
KNOWN (the measurements) / UNKNOWABLE from DataShoal’s data (the attribution) · measured; attribution not assessed.
Southern California’s coastal water turned warm a year ago, during a La Niña, well before this El Niño developed. The August jump to a record came as El Niño strengthened, but the data we hold cannot split the two influences apart, so we don’t. September stayed about as warm, at +2.8 °C the second-warmest September since 1981, after 2015, and central Oregon’s coastal water was back above normal (KNOWN · measured).
NOAA tracks large marine heatwaves as basin-scale patches of unusually warm surface water, usually far offshore, and one of them drew much of this year’s attention. Another, NEP26A, ran from June 5th to about mid-September and never came closer than about 900 miles (1,450 km) to the coast (KNOWN · measured, NOAA’s tracker). The chart below shows the water much closer in, 20 to 25 miles (30 to 40 km) off Humboldt, Tomales and Morro Bays.
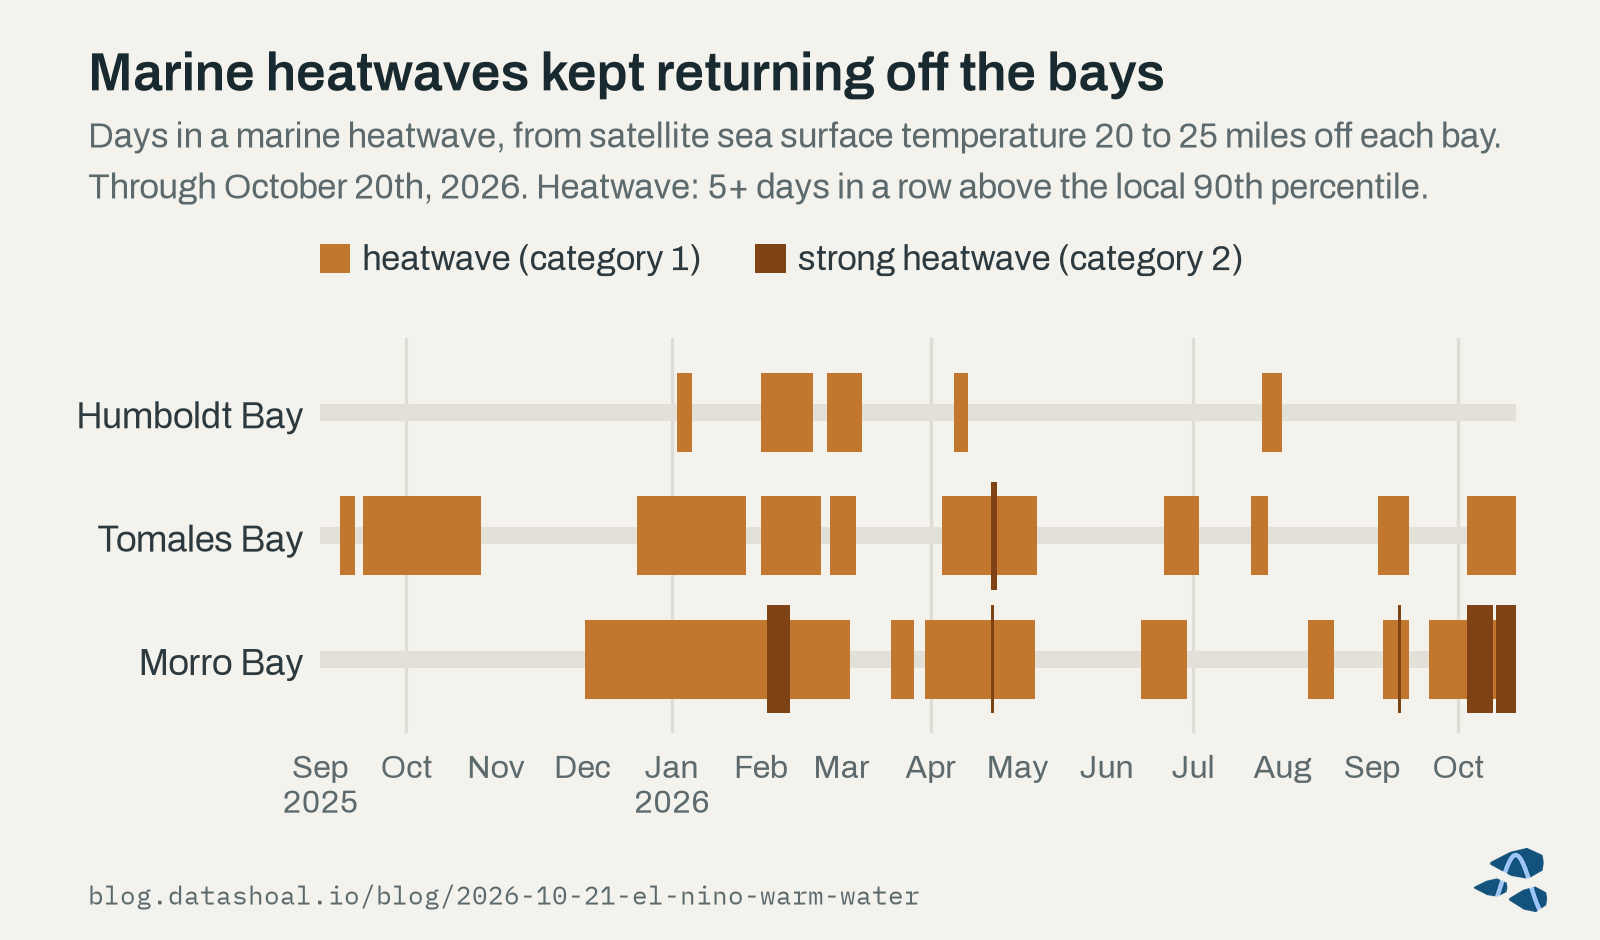
The large offshore 2025-26 marine heatwave (NEP25A) ended on July 2nd, 2026 and never came closer than about 470 miles (750 km) to the coast. Closer in, short marine heatwaves recurred off Tomales and Morro Bay through the summer; the latest ended on September 13th (Morro’s reached category 2). On September 22nd none was active, although water off both bays was back above the heatwave threshold for 1-2 days, too short to call.
KNOWN · measured, by satellite about 20-25 miles (30-40 km) offshore.
The newer data settle those last days. Off Morro Bay they were the start of a heatwave that began on September 21st; off Tomales Bay they stayed too short, and a heatwave began there on October 4th. Both were still going on October 20th, the latest day of satellite data, and Morro’s has been at category 2 for most of October so far (KNOWN · measured, by satellite 20 to 25 miles offshore; the last two weeks of data are preliminary).
A marine heatwave here means at least five days in a row above the local 90th percentile for that time of year, measured against 2003 to 2022, a shorter baseline than the usual 30 years. The satellite readings we use come from 20 to 25 miles outside each bay, so they describe the water the bays exchange with, not the water over the beds, and they see only the surface. In shallow water off a pier in San Luis Obispo Bay, about a third of the days with a marine heatwave at the bottom had none at the surface (Plume and colleagues, 2025).
Looking ahead, an existing temperature anomaly near the coast tends to persist: Jacox and colleagues (2017) found that simply assuming it will continue is a skillful forecast in the California Current out to about four months, though less so for forecasts made in late summer. On that basis, our outlook for Southern California’s coastal water from October through December leans warmer than normal, as persistence of the current anomaly (INFERRED · case study, 4 past events; medium confidence). Looking further out, the extra marine heatwave days in the spring after past El Niño winters did not hold up under our checks (INFERRED · not robust).
What history says about Vibrio
Vibrio bacteria, above all Vibrio parahaemolyticus, grow faster in warm water and are a leading cause of illness from raw oysters in summer. California’s records give one historical pattern.
Historically, California vibriosis cases (reported by county of residence, all non-cholera Vibrio species, 2001-2023) ran higher in the calendar year an El Niño develops; that is not a forecast of 2026 or 2027 cases, and in the year after El Niño winters cases did not run higher.
INFERRED · supported as a hindcast association (statewide).
Summer water near our three bays did not show a matching pattern: summer water temperature near Humboldt, Tomales and Morro in El Niño developing years showed no clear difference from other years (INFERRED · not supported). The case counts also cover all non-cholera Vibrio species and are not tied to any one growing area or food. So we read the association as a reason to watch summer water temperature closely in El Niño years, not as a measure of risk at any one growing area. Heat stress on oysters exposed at low tide is another summer concern we could not assess with the data we hold.
What we’re watching
- Monthly sea level at the California gauges through the winter, against the ranges above.
- Daily water levels at NOAA’s tide gauges (published online), where passing Kelvin waves show up, and how high this winter’s king tides run.
- Coastal water temperature and heatwave days near each bay, with the caveat that the satellite reads the water offshore, not in the bays.
- Next summer, water temperature in the bays themselves, where Vibrio grows.
For Humboldt, Tomales and Morro Bay, our weekly State of the Bay report carries Growth conditions and Vibrio early warning indicators for each bay. You can read a sample report. Pilot access is open now.
Next week, the last in this series: what past strong El Niños did the following year, and why spring 2028 is on our watch list.
Sources
- Amaya, D. J. (2026). 2026-2027 El Niño Updates: coastal trapped waves. dillonamaya.com/home/ctw (read October 21st, 2026; updated daily).
- Jacox, M. G., Fiechter, J., Moore, A. M., and Edwards, C. A. (2015). ENSO and the California Current coastal upwelling response. Journal of Geophysical Research: Oceans 120:1691-1702.
- Jacox, M. G., Alexander, M. A., Stock, C. A., and Hervieux, G. (2017; print issue 2019). On the skill of seasonal sea surface temperature forecasts in the California Current System and its connection to ENSO variability. Climate Dynamics 53:7519-7533.
- NOAA Climate Prediction Center (2026). ENSO: Recent Evolution, Current Status and Predictions, update of October 19th, 2026. cpc.ncep.noaa.gov/products/analysis_monitoring/lanina/enso_evolution-status-fcsts-web.pdf (replaced each week).
- NOAA National Ocean Service (2026). What is a Kelvin wave? oceanservice.noaa.gov/facts/kelvin-waves.html (updated October 15th, 2026).
- Plume, G., Walter, R. K., Cobb, I., Dalsin, M., Mazzini, P. L. F., Shunk, N. P., Robbins, I., and Connolly, T. P. (2025). Vertical structure of subsurface marine heatwaves in a shallow nearshore upwelling system. Scientific Reports 15:6353.
Corrections welcome
If you grow shellfish, sample the water, or study the ocean along this coast, we’d like to hear from you.
About this post
Not a closure notice. Harvest closures are regulatory determinations made by the responsible shellfish-safety authority. DataShoal describes conditions; it does not issue, replace, or predict closures. Always confirm current harvest status before harvesting.
Data. Coastal water temperature and marine heatwaves: NOAA OISST v2.1 (psl.noaa.gov). Sea level: NOAA CO-OPS tide gauges (tidesandcurrents.noaa.gov). Offshore heatwave tracking: NOAA’s California Current Integrated Ecosystem Assessment (oceanview.pfeg.noaa.gov). Vibriosis cases: California Department of Public Health, via the California Health and Human Services open data portal (data.chhs.ca.gov). Tropical Pacific indices and Kelvin waves: NOAA Climate Prediction Center (cpc.ncep.noaa.gov). Coastlines on the Kelvin-wave map: Natural Earth (naturalearthdata.com). No provider endorses this post.
How this was written. Written with the assistance of an AI model from DataShoal’s analysis and the sources above, and edited by Austin Maguire.