On the blog this week for our El Niño series, we’ll be turning to phytoplankton, the microscopic algae that shellfish filter from the water, and the few species among them that produce toxins of concern.
The best studied on the Pacific west coast is Pseudo-nitzschia, a diatom that can produce domoic acid, the toxin behind amnesic shellfish poisoning. Shellfish that filter it concentrate the toxin, and California, Oregon and Washington test shellfish meat and close harvest when levels pass the regulatory limit. Other toxin-producing phytoplankton of concern are Alexandrium (paralytic shellfish poisoning) and Dinophysis (diarrhetic shellfish poisoning). But domoic acid is where the El Niño question has been asked most often, and where the records are richest.
The hypothesis
El Niño raises the risk of domoic acid along the West Coast, and ocean-climate indices add forecast skill beyond what the local ocean already shows.
What El Niño does to the California Current
Along most of the West Coast, spring and summer winds push surface water offshore, and cold, nutrient-rich water rises from below to replace it. That upwelling feeds the phytoplankton blooms that make the California Current one of the most productive stretches of ocean in the world, and it is a big part of why West Coast shellfish grow so well. El Niño reaches this system in two ways: through the winds, and through the ocean itself, which carries warmer water up the coast from the tropics (more on that in next week’s post on sea level).
What the research says about toxic blooms
The best-known recent toxic bloom came in 2015, while El Niño conditions were still building toward the 2015-16 peak. It was the largest domoic acid outbreak on record on the West Coast, and it closed razor clam, rock crab and Dungeness crab fisheries for months. McCabe and colleagues (2016) traced it to three steps: toxic Pseudo-nitzschia australis thriving in the warm, nutrient-poor water of the 2014-15 marine heatwave; a pulse of nutrients when spring upwelling began; and a run of storms that pushed the bloom onshore. That is one event, and this year the North Pacific is running cool, not warm.
McKibben and colleagues (2017) linked domoic acid in Oregon razor clams to a warm tropical Pacific combined with a warm North Pacific. As we noted in our first post in this series, 2026 has the first half of that pairing (the warm tropical Pacific) and not the second (the warm North Pacific). Past strong El Niños with a cool North Pacific are too few in the toxin records we analyzed to test how the link behaves in a year like this one (INFERRED · case study; what the labels mean).
A third study, by Trainer and colleagues (2000), documented a highly toxic Pseudo-nitzschia australis population near Morro Bay in early June 1998, at the end of the 1997-98 El Niño; the authors suggest cool upwelled water just north of the bay may have supplied its nutrients. Its highest count there, about 49,000 cells per liter, was just under the 50,000-cell line we use below to define a bloom, so an alarm set at that line would have missed it (INFERRED · case study, 1 event).
What the pier records add
For well over a decade, the California Harmful Algal Bloom Monitoring and Alert Program (CalHABMAP) has sampled seawater at piers along the California coast most weeks. It counts Pseudo-nitzschia cells and measures particulate domoic acid, the toxin held in the algal cells, in each water sample. That record lets us ask how often a bloom turns toxic.
We counted a bloom when Pseudo-nitzschia seriata-group cells reached 50,000 per liter at a pier that also measures domoic acid, and asked whether particulate domoic acid of at least 0.5 nanograms per milliliter of seawater followed within eight weeks. The 0.5 line is a working threshold for water samples, not a regulatory limit, which applies to shellfish meat. The answer, in the chart above, is about 1 in 3 (37 of 119 blooms, bloom years 2008-09 to 2025-26; INFERRED · supported, descriptive).
So most blooms were not followed by toxin at that level, though lower amounts, under 0.5, do turn up. That is why a cell count alone over-warns.
We also tested whether El Niño indices help predict blooms and toxin in real time.
In DataShoal’s hindcast tests, El Niño and North Pacific climate indices added no detectable forecast skill beyond local ocean state to 1-8-week forecasts of Pseudo-nitzschia bloom and domoic-acid onsets at California piers; the tests could only have detected gains of about 0.01-0.06 in Brier skill, as large as the local models’ own skill (4 independent El Niño events). No DataShoal model met the early-warning standard, so this outlook is context, not an alarm.
KNOWN · hindcast tests (no detectable gain; low power).
In plain terms, the few past El Niños in the monitoring record were not enough to show whether knowing the El Niño state helps predict a bloom weeks ahead, beyond what the local water was already telling us.
From the water to the shellfish meat
Harvest decisions turn on toxin in the shellfish meat itself, which is one step removed from blooms and toxin in the water. The California Department of Public Health (CDPH) has tested shellfish meat at several of the same piers for years, so we matched the two records. Starting from the meat samples that reached California’s action level of 20 ppm, we checked whether the pier’s seawater had shown toxin in the 28 days before.
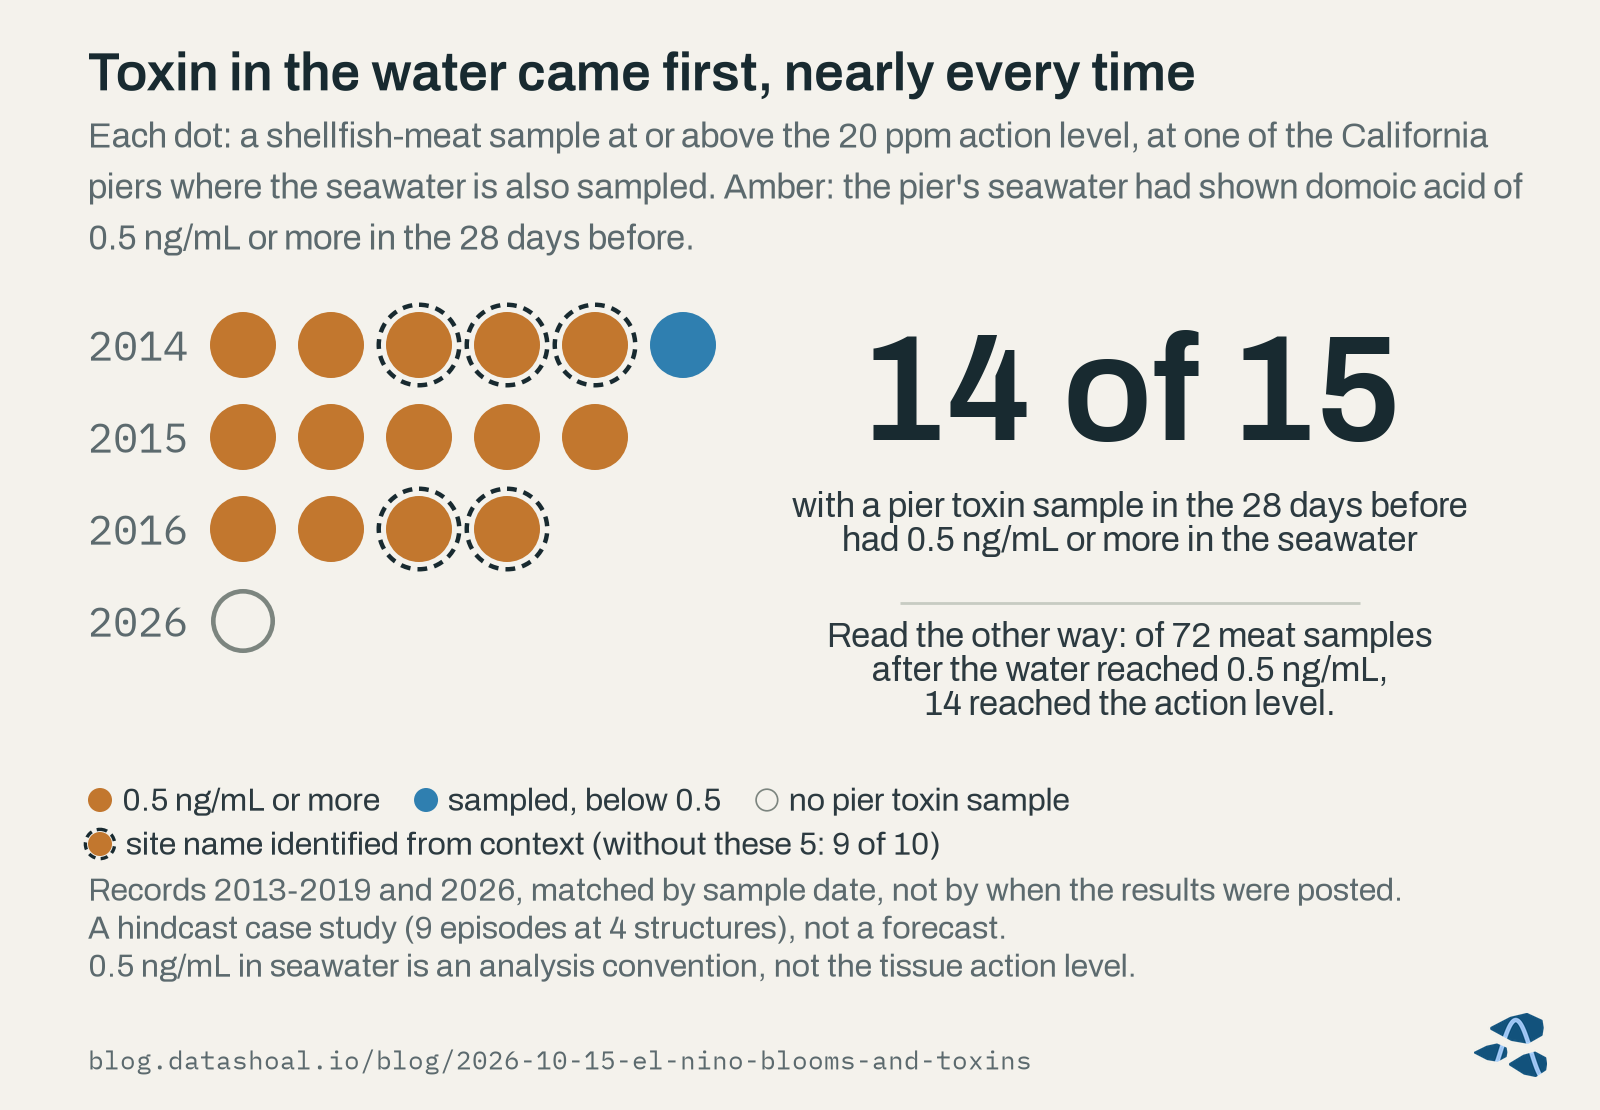
In these records, the seawater almost always had. Of the 16 meat samples that reached the action level, 15 had a pier particulate domoic acid sample in the 28 days before, and 14 of those 15 showed at least 0.5 ng/mL in seawater (an analysis convention, not the tissue action level). And 5 of the 16 rest on a site name we identified from context; without those 5, the 14 of 15 becomes 9 of 10 (INFERRED · case study; hindcast). The one with no pier particulate domoic acid sample in the window is this season’s, from Monterey on September 1st, 2026; CalHABMAP’s online record for that wharf, as we fetched it in September, has no particulate domoic acid result after August 2022.
Read the other way, the link is much looser. When particulate domoic acid in the pier’s seawater had reached 0.5 ng/mL in the 28 days before a sample, domoic acid was detected in about 2 in 5 meat samples and reached the action level in about 1 in 5, the same 14 samples as above (29 and 14 of 72; INFERRED · case study: 12 detection episodes in the high class; hindcast). So toxin in the water came before nearly every action-level sample, but most meat samples that followed it stayed below the action level.
These results come from a handful of piers, mostly Santa Cruz Wharf, mostly in the 2014-2016 bloom years. They were read after the fact and matched by sample date, not by when the results were posted, so they are not a forecast, not a trigger, and not a base rate for any growing area.
What it means for this season
This year pairs a cool North Pacific with a central equatorial Pacific that is warmer for the time of year than in any year since 1950 on NOAA’s current index. That combination has few precedents, and the history above is a set of case studies, not a rule. The useful signal comes from the water near each growing area, week by week: cell counts, toxin in the water, and above all the official shellfish tests.
When we checked in September, the newest toxin results online for several Southern California piers were more than a month old, because results are posted weeks after sampling (KNOWN · measured). Any early warning built on these data has to plan around that delay.
The official word on whether shellfish are safe to harvest comes from each state’s shellfish program: the California Department of Public Health, the Oregon Department of Agriculture and the Washington State Department of Health. Nothing here replaces their tests. For Humboldt, Tomales and Morro Bay, our weekly State of the Bay report carries a Biotoxin early warning indicator alongside the bay’s water conditions. You can read a sample report. Pilot access is open now.
Next week: warm water and high water, and what the ocean along the coast is already showing.
Sources
- McCabe, R. M., et al. (2016). An unprecedented coastwide toxic algal bloom linked to anomalous ocean conditions. Geophysical Research Letters 43:10,366-10,376.
- McKibben, S. M., et al. (2017). Climatic regulation of the neurotoxin domoic acid. Proceedings of the National Academy of Sciences 114:239-244.
- Trainer, V. L., et al. (2000). Domoic acid production near California coastal upwelling zones, June 1998. Limnology and Oceanography 45:1818-1833.
Corrections welcome
If you grow shellfish, sample the water, or study harmful algal blooms on this coast, we’d like to hear from you.
About this post
Not a closure notice. Harvest closures are regulatory determinations made by the responsible shellfish-safety authority. DataShoal describes conditions; it does not issue, replace, or predict closures. Always confirm current harvest status before harvesting.
Data. Phytoplankton and domoic-acid data from CalHABMAP, the California Harmful Algal Bloom Monitoring and Alert Program, co-sustained by the Southern California Coastal Ocean Observing System (SCCOOS) and the Central and Northern California Ocean Observing System (CeNCOOS) (calhabmap.org). Shellfish tissue (meat) results published by the California Department of Public Health’s marine biotoxin monitoring program (cdph.ca.gov). El Niño years: Oceanic Niño Index from the NOAA Climate Prediction Center (cpc.ncep.noaa.gov). No provider endorses this post.
How this was written. Written with the assistance of an AI model from DataShoal’s analysis and the sources above, and edited by Austin Maguire.