Rain is the El Niño story most Californians remember, from the storms of 1982-83 and 1997-98. For shellfish growers, rain matters for a more specific reason. Runoff carries bacteria and viruses from the land into the water, so each commercial growing area in California has a management plan that closes harvest after a set amount of rain in 24 hours (at Morro Bay, after the creek rises past a set height) and keeps it closed for a set number of days. A wet winter can mean weeks of lost harvest.
This is the first of our deep dives into what the current El Niño might mean for West Coast shellfish. We start with a hypothesis, look at what the published research suggests, and then see what the data can add.
The hypothesis
El Niño winters bring more rain-closure days to California’s shellfish growing areas, and the south feels it most.
What the literature says
Two studies shaped how we approached this. Cayan, Redmond and Riddle (1999) looked at daily rainfall and streamflow across the western United States and found that El Niño winters bring more heavy-rain days and high-flow days to the Southwest and fewer to the Northwest. The shift is clearest in the heaviest storms. Along the central California coast the response shows up mainly at that heavy end, and the paper states no El Niño result for Humboldt specifically.
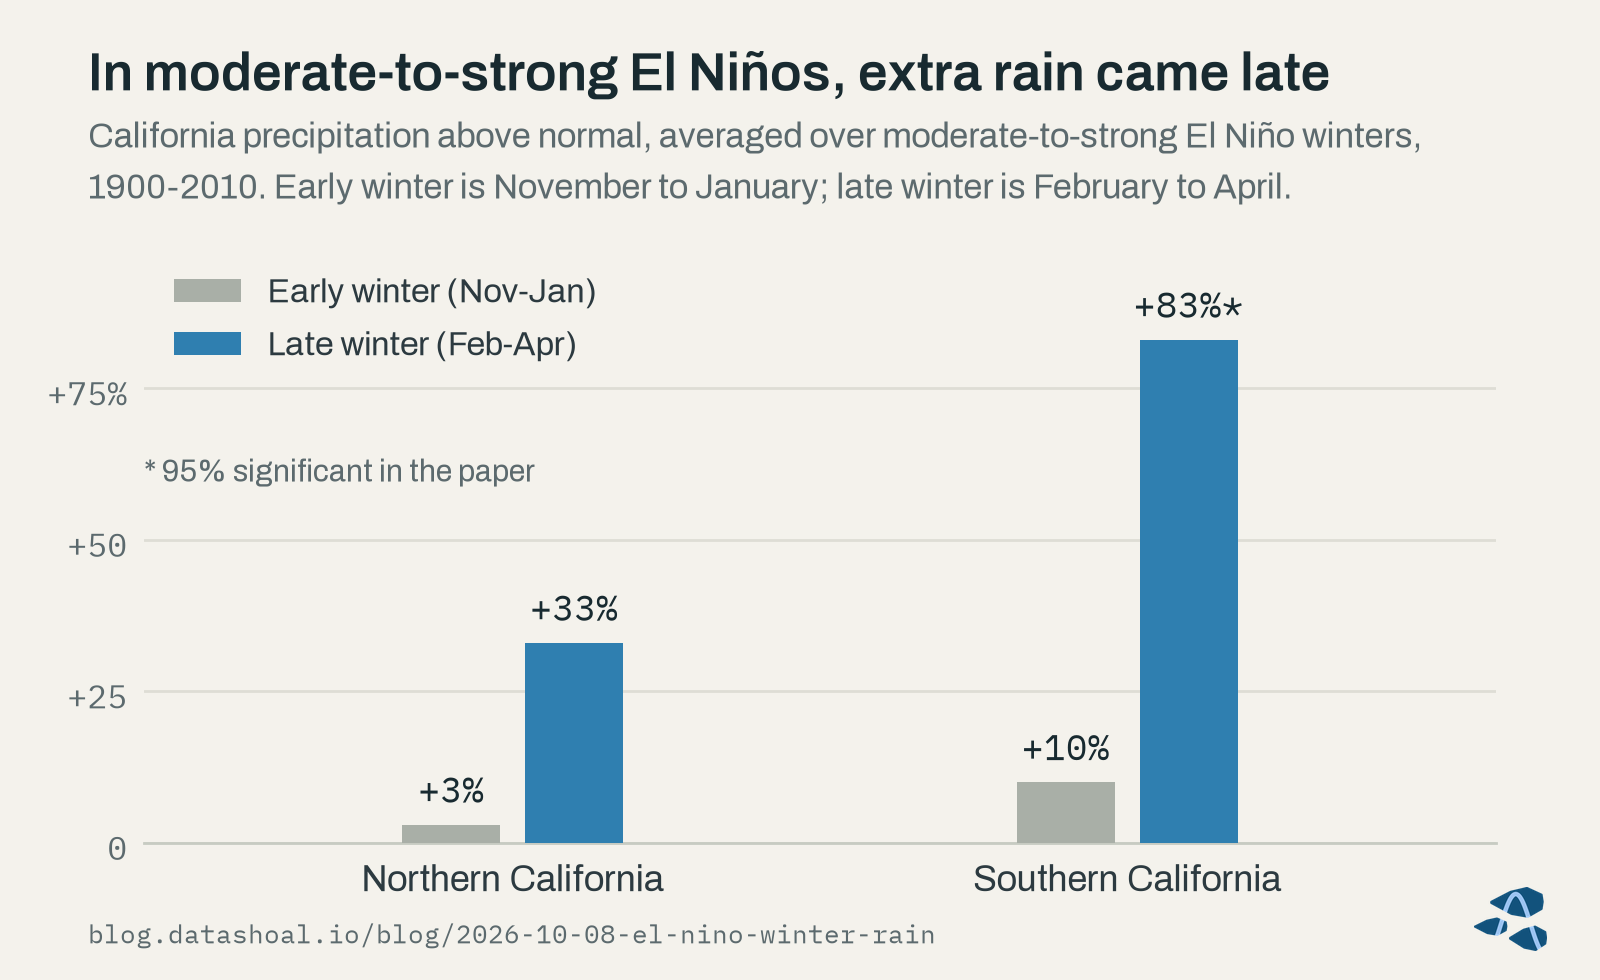
Jong, Ting and Seager (2016) asked when in the winter the extra rain arrives. Across a century of El Niños, the effect on California precipitation was much stronger in late winter, February through April, than in November through January, stronger in the south than the north, and dependable only in moderate-to-strong events. In 8 of 10 moderate-to-strong El Niños, late-winter precipitation in southern California landed in the wettest third of years. Their averages are in the chart below: in those El Niños, late-winter precipitation ran 33 percent above normal in northern California and 83 percent in southern California, against 3 and 10 percent in early winter. Only the southern late-winter figure is marked significant at 95 percent in the paper.
Neither study separates El Niño winters by the state of the North Pacific, which this year is unusually cool (see our first post), so how that changes the picture is an open question.
What our data add
What a grower needs to know is closures, and a closure depends on each growing area’s own rule. We applied today’s California closure rules to the rainfall record at or near each rule’s gauge, for every winter from 1950 to 2025, at five growing areas: Humboldt Bay, Tomales Bay, Morro Bay, the Santa Barbara Channel growing area and Agua Hedionda Lagoon. For Tomales Bay we used a long-running gauge about 23 miles away, because the regulatory gauge’s record is not openly available, and for Morro Bay we used CDPH’s alternate rainfall rule, which applies when creek-stage data are missing. We call the result rule-implied exposure: the days today’s rules would have closed each growing area, given past weather. It is not a record of actual closures, which the California Department of Public Health (CDPH) decides. Where recent CDPH closure records exist, we used them to check the reconstruction day by day.
Averaged over all El Niño winters, only one growing area showed a difference that held up.
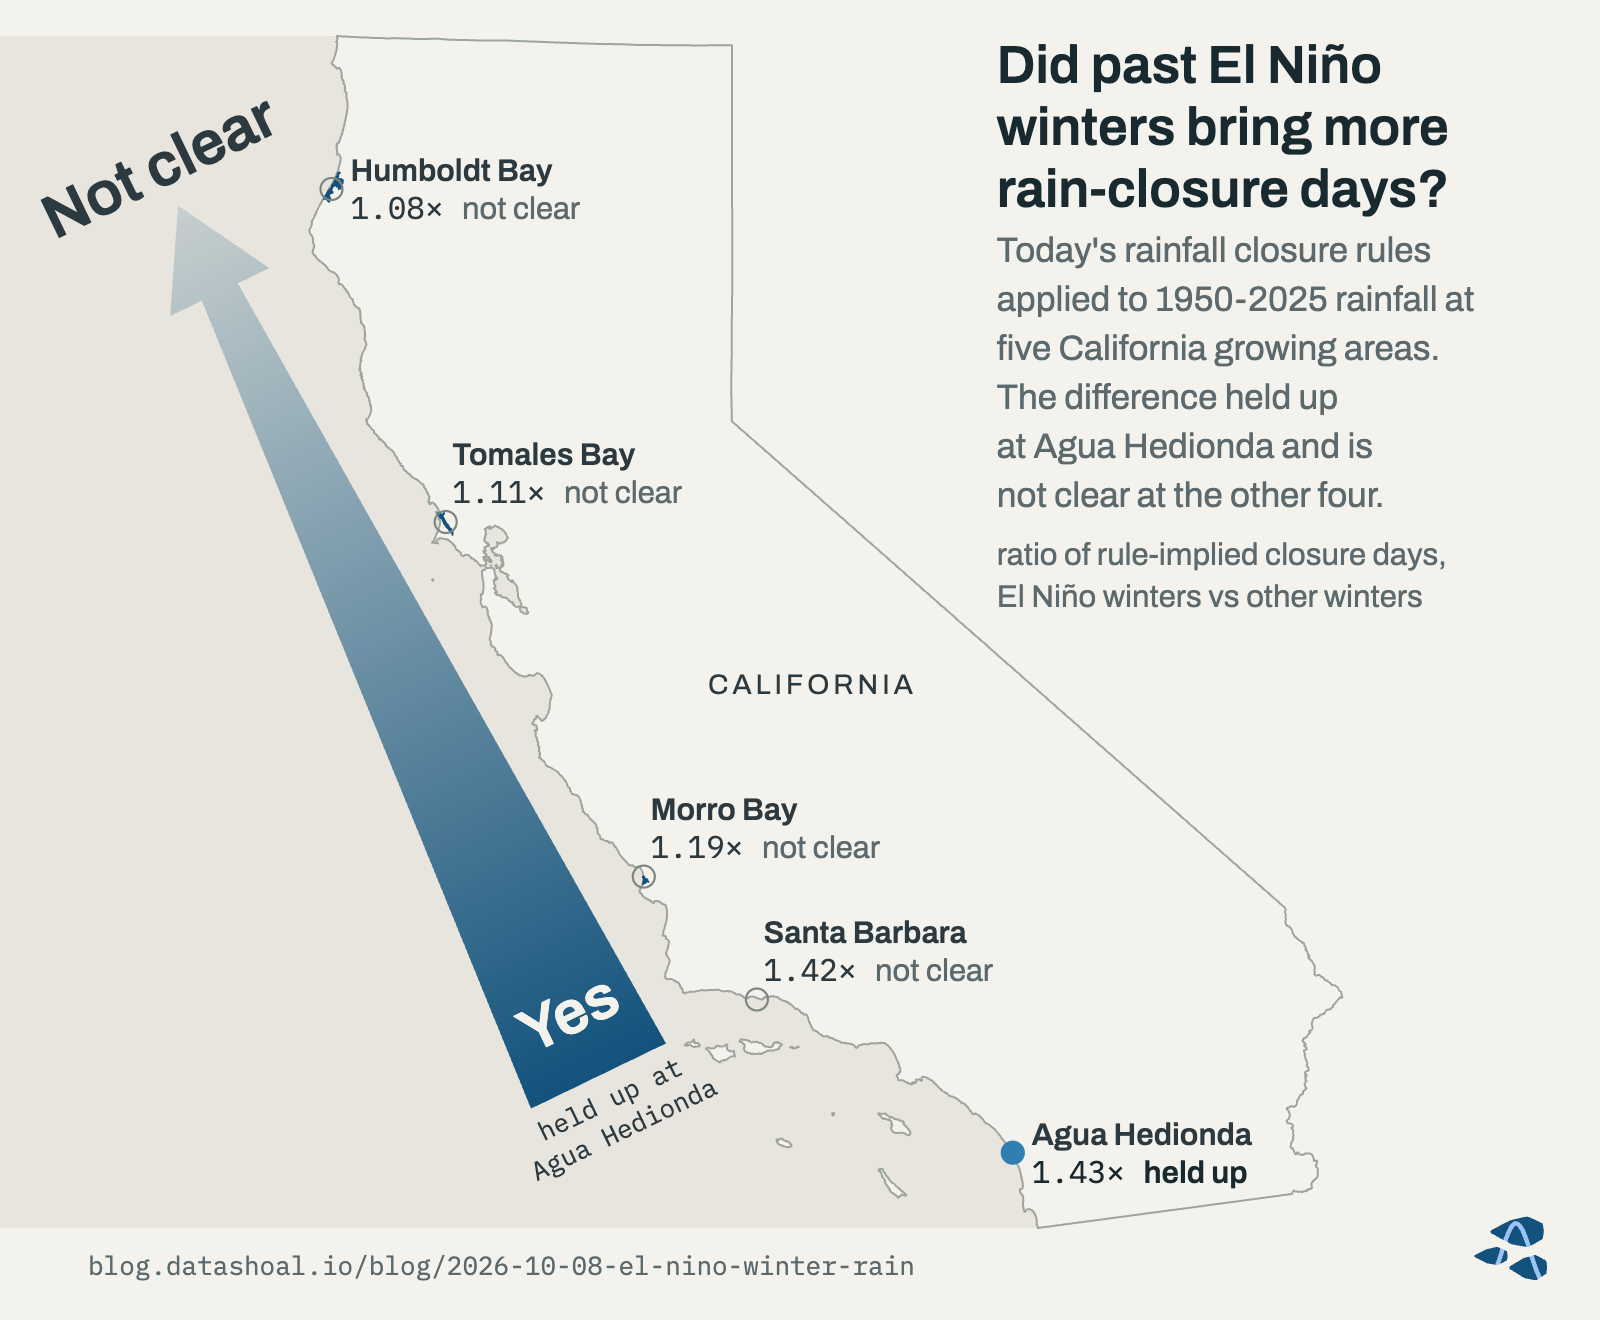
Historically, rule-implied rain-closure exposure at Agua Hedionda Lagoon ran about 40% higher in El Niño winters (today’s closure rules applied to past rainfall, 1950-2025; days a rule would have closed the lagoon, not a count of actual closures); it bears on 2026-27 only if this winter verifies as an El Niño. At Humboldt, Tomales, Morro and Santa Barbara the El Niño difference is not clear: the estimates are 8-42% higher, but none passes DataShoal’s tests.
INFERRED · supported (Agua Hedionda; rule-implied exposure, hindcast); no clear difference (the other four growing areas).
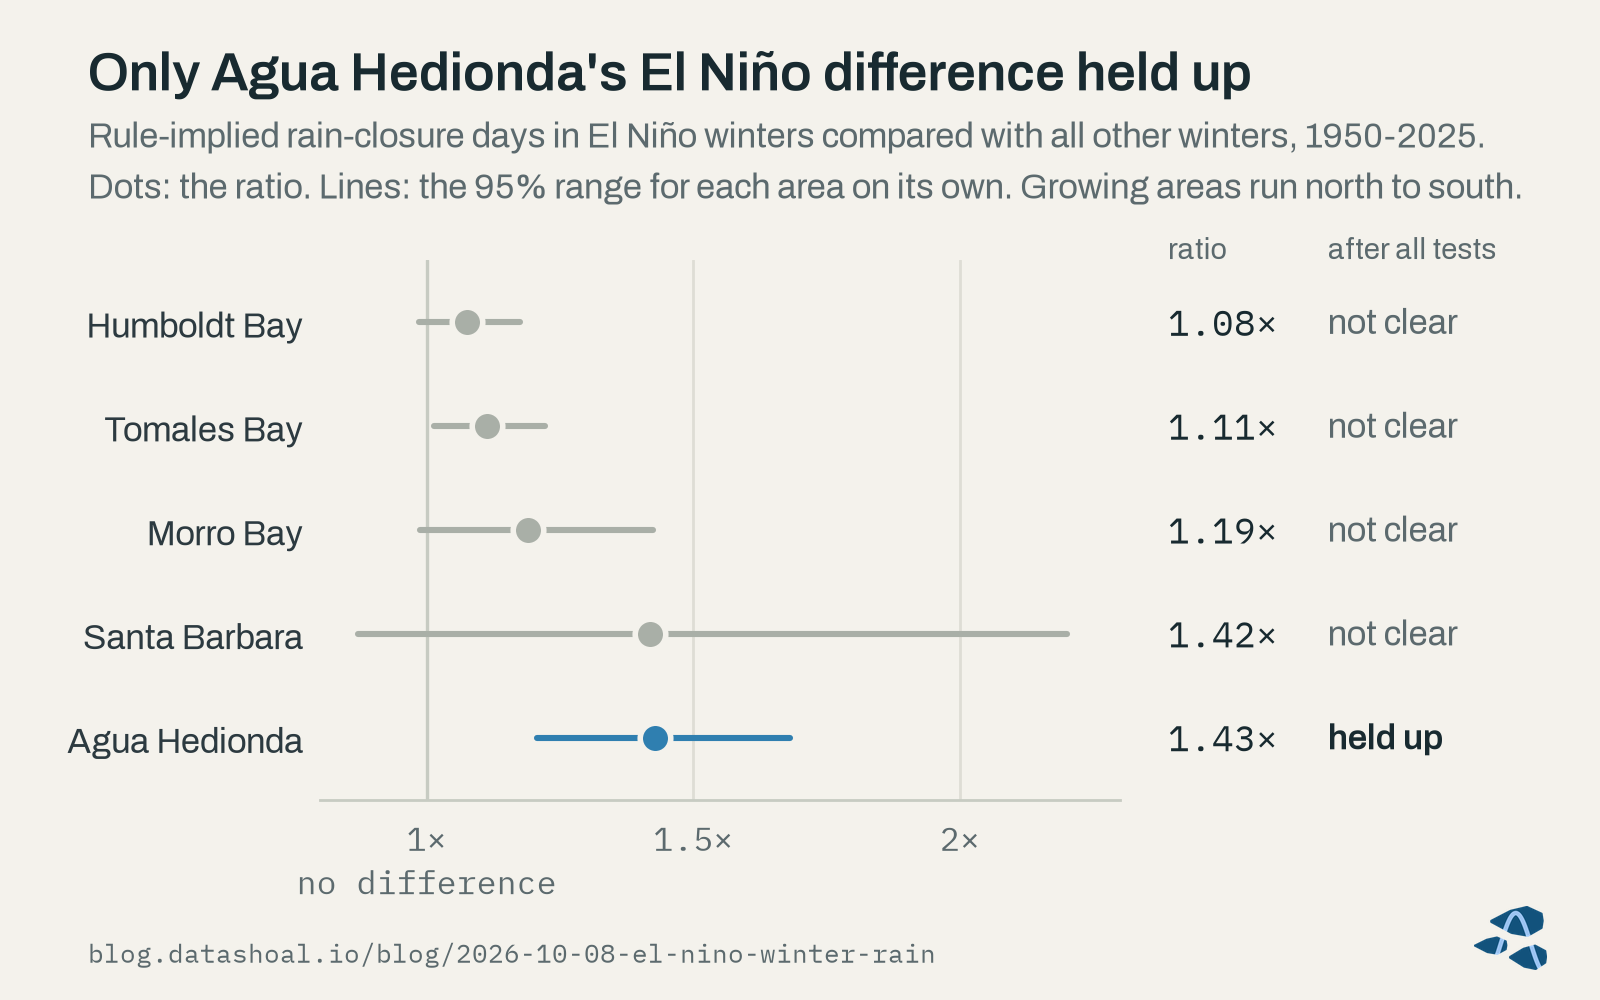
Santa Barbara’s estimate is nearly as large as Agua Hedionda’s, but its range is wide: the growing area sees only a handful of rule-implied closure days in a typical winter, so a single storm swings the ratio. We also checked whether the Agua Hedionda result was an artifact of the shift in West Coast ocean conditions since 2014. It was not: allowing for that shift, an El Niño winter still carried about 13 more rule-implied closure days at the lagoon than other winters, with a 95% range of about 6 to 19 days (INFERRED · supported, rule-implied exposure, hindcast).
The south was not clearly hit harder once each growing area is compared with its own history (INFERRED · not supported). The southern growing areas’ larger ratios mostly reflect how few closure days they see in an average winter. On the map, that is one growing area where the El Niño difference held up and four where it is not clear.
The most striking pattern appears when we look only at the strong eastern-Pacific El Niños, the chart at the top of this post.
In the 8 past strong eastern-Pacific El Niño winters, rain-closure exposure was close to all-or-nothing across California’s five assessed growing areas: 4 winters put at least 4 of the 5 growing areas in their top quarter of winters for rule-implied closure days, while 3 (including 2015-16) put none.
INFERRED · case study (8 winters).
One winter sits in between (1972-73 lit up three growing areas). Counting El Niños by a second, slightly different rule adds the 2009-10 winter, which put 2 of the 5 growing areas in their top quarter.
Four of those 8 winters began, like this one, on a cool June-July North Pacific. In those four, the typical winter’s rule-implied exposure was ordinary to moderately raised, below the typical strong eastern-Pacific winter at four of the five growing areas, and they split as well: 1965-66 and 1991-92 put no growing area in its top quarter, while 2023-24 put all five (INFERRED · case study, 4 winters).
What it means for this winter
Three things carry forward from the history, with the caveat that none of them is a forecast of closures.
The Agua Hedionda result bears on 2026-27 only if this winter counts as an El Niño winter, and the evidence points firmly that way. NOAA’s October 8th outlook calls a strong-to-very strong El Niño likely through January-March 2027, and since 1950 every year with El Niño conditions in July-September went on to an El Niño winter, 15 of 15 (KNOWN · measured). If the published late-winter pattern holds, most of the difference would come from February to April (INFERRED · literature, not tested by us). And a strong El Niño does not guarantee high exposure at any particular growing area: in 2015-16 a very strong event put none of the five growing areas in its top quarter of winters for rule-implied closure days.
For Humboldt, Tomales, Morro and Santa Barbara, the history gives no clear El Niño signal to plan around. North of California, we did not reconstruct Oregon’s or Washington’s closure rules, and each state’s rules stay its own. The literature leans toward fewer heavy-rain days in the Northwest during El Niño winters, but we have not assessed that ourselves.
What we’re watching
Through the winter we are tracking rainfall at or near each growing area’s regulatory gauge and the running count of rule-implied days against its top-quarter line. After the season, once CDPH’s 2026-27 closure records are available, we will check the reconstruction and this post against what actually happened and report back.
Only CDPH decides when a California growing area closes or reopens. If you farm in Humboldt, Tomales or Morro Bay, our weekly State of the Bay report carries a Rainfall closure risk indicator for your bay alongside its water conditions. You can read a sample report. Pilot access is open now.
Next week: phytoplankton blooms, domoic acid, and what the pier records say about El Niño years.
Sources
- Cayan, D. R., Redmond, K. T., and Riddle, L. G. (1999). ENSO and hydrologic extremes in the western United States. Journal of Climate 12:2881-2893.
- Jong, B.-T., Ting, M., and Seager, R. (2016). El Niño’s impact on California precipitation: seasonality, regionality, and El Niño intensity. Environmental Research Letters 11:054021.
Corrections welcome
If you grow shellfish, sample the water, or study any of these growing areas, we’d like to hear from you.
About this post
Not a closure notice. Harvest closures are regulatory determinations made by the responsible shellfish-safety authority. DataShoal describes conditions; it does not issue, replace, or predict closures. Always confirm current harvest status before harvesting.
Data. Rainfall: NOAA National Centers for Environmental Information, Global Historical Climatology Network daily records (ncei.noaa.gov), with Iowa Environmental Mesonet airport observations (mesonet.agron.iastate.edu). Closure rules: CDPH Shellfish Program growing-area management plans (cdph.ca.gov/shellfish). El Niño winters and the North Pacific: Oceanic Niño Index from the NOAA Climate Prediction Center (cpc.ncep.noaa.gov) and Pacific Decadal Oscillation from the NOAA Physical Sciences Laboratory (psl.noaa.gov). Map outlines: U.S. Census Bureau cartographic boundary files (census.gov) and California Department of Fish and Wildlife Marine Region GIS (wildlife.ca.gov). No provider endorses this post.
How this was written. Written with the assistance of an AI model from DataShoal’s analysis and the sources above, and edited by Austin Maguire.