This is the first post in our series on what the current El Niño might mean for West Coast shellfish aquaculture. A new post follows each week through October, each taking one question, looking at what the published research says, and then seeing what the data add. This overview covers where the Pacific stands, what our tests found, and what they cannot tell us yet.
For the series we gathered the climate indices, ocean measurements and shellfish monitoring records we could get, built a bibliography of about two hundred papers on El Niño and the California Current, and reviewed the most relevant two dozen in full. We set out eleven hypotheses at the start, drawn from that literature, about how an El Niño reaches a shellfish bay, and we tested eight of them; the other three were not tested in this round.
How to read the boxed statements
The boxed statements in this series are our outlook, written down on September 23rd and quoted unchanged in every post. Each carries two labels. The first says what kind of statement it is: KNOWN means measured; INFERRED means reasoned from past years or the published literature, so it could be wrong; UNKNOWABLE means it cannot be known yet from the data we hold. The second says how strong the evidence is: supported, a case study (too few past events to call it a pattern), not robust (it failed our checks), not supported, no clear difference, or not assessed. Claims outside the boxes carry the same labels in parentheses.
What this means for your farm
The central equatorial Pacific is warmer for the time of year than in any year since 1950 on NOAA’s current index (KNOWN · measured). But the few past El Niños in the monitoring record were not enough to show whether knowing the El Niño state helps predict a bloom weeks ahead at California’s monitored piers, beyond what the local water was already showing (KNOWN · hindcast tests, no detectable gain; low power). So this series makes no toxin or closure forecast for 2026-27. The measurements closest to your farm stay the ones to watch, week by week. Next week’s post takes up what past El Niño winters meant for rain-closure exposure at five California growing areas.
Where the Pacific stands
El Niño is a warming of the surface of the central and eastern tropical Pacific. It shifts the jet stream, storm tracks, and ocean currents far from the equator, including along our coast. Scientists track it with the Oceanic Niño Index (ONI), a three-month average of sea surface temperature in a stretch of the equatorial Pacific called the Niño-3.4 region, compared with normal. Readings of +0.5 °C or more mark El Niño conditions, and events that peak at +1.5 °C or more are usually called strong.
This year’s event has started fast. The chart above replays every year of NOAA’s weekly record for the Niño-3.4 region, with 2026 drawn in amber.
As of September 23rd, 2026 the central equatorial Pacific (the Niño-3.4 region) is warmer for the time of year than in any year since 1950: the June-August Oceanic Niño Index is +1.80 °C, against a previous June-August high of +1.48 °C in 1997 (both on NOAA’s current, September 2026 version of the index; the earlier version had 1997 at +1.60 °C). The weekly Niño-3.4 value reached +3.0 °C in the week centred on September 16th, higher than any September week since the weekly satellite record began in 1982 (previous September high +2.1 °C, in 1997).
KNOWN · measured.
NOAA has since added the week centred on September 23rd, at +3.1 °C, now the warmest September week on the weekly record (KNOWN · measured).
Between late July and late September, NOAA moved the ONI to a new sea surface temperature dataset, and the update revised nearly every value back to 1950 (KNOWN · measured). The record holds on the current version, and we will say which version we mean whenever a record is relevant.
How strong the event gets is still open.
NOAA’s Climate Prediction Center (September 10th, 2026) puts the chance of a very strong El Niño this fall and winter above 90%, and the chance that October-December 2026 is stronger than any El Niño since 1950 at 75%; these are forecasts, not observations.
KNOWN that the forecasts exist; UNKNOWABLE how strong the event will peak · external forecast.
An El Niño with few precedents
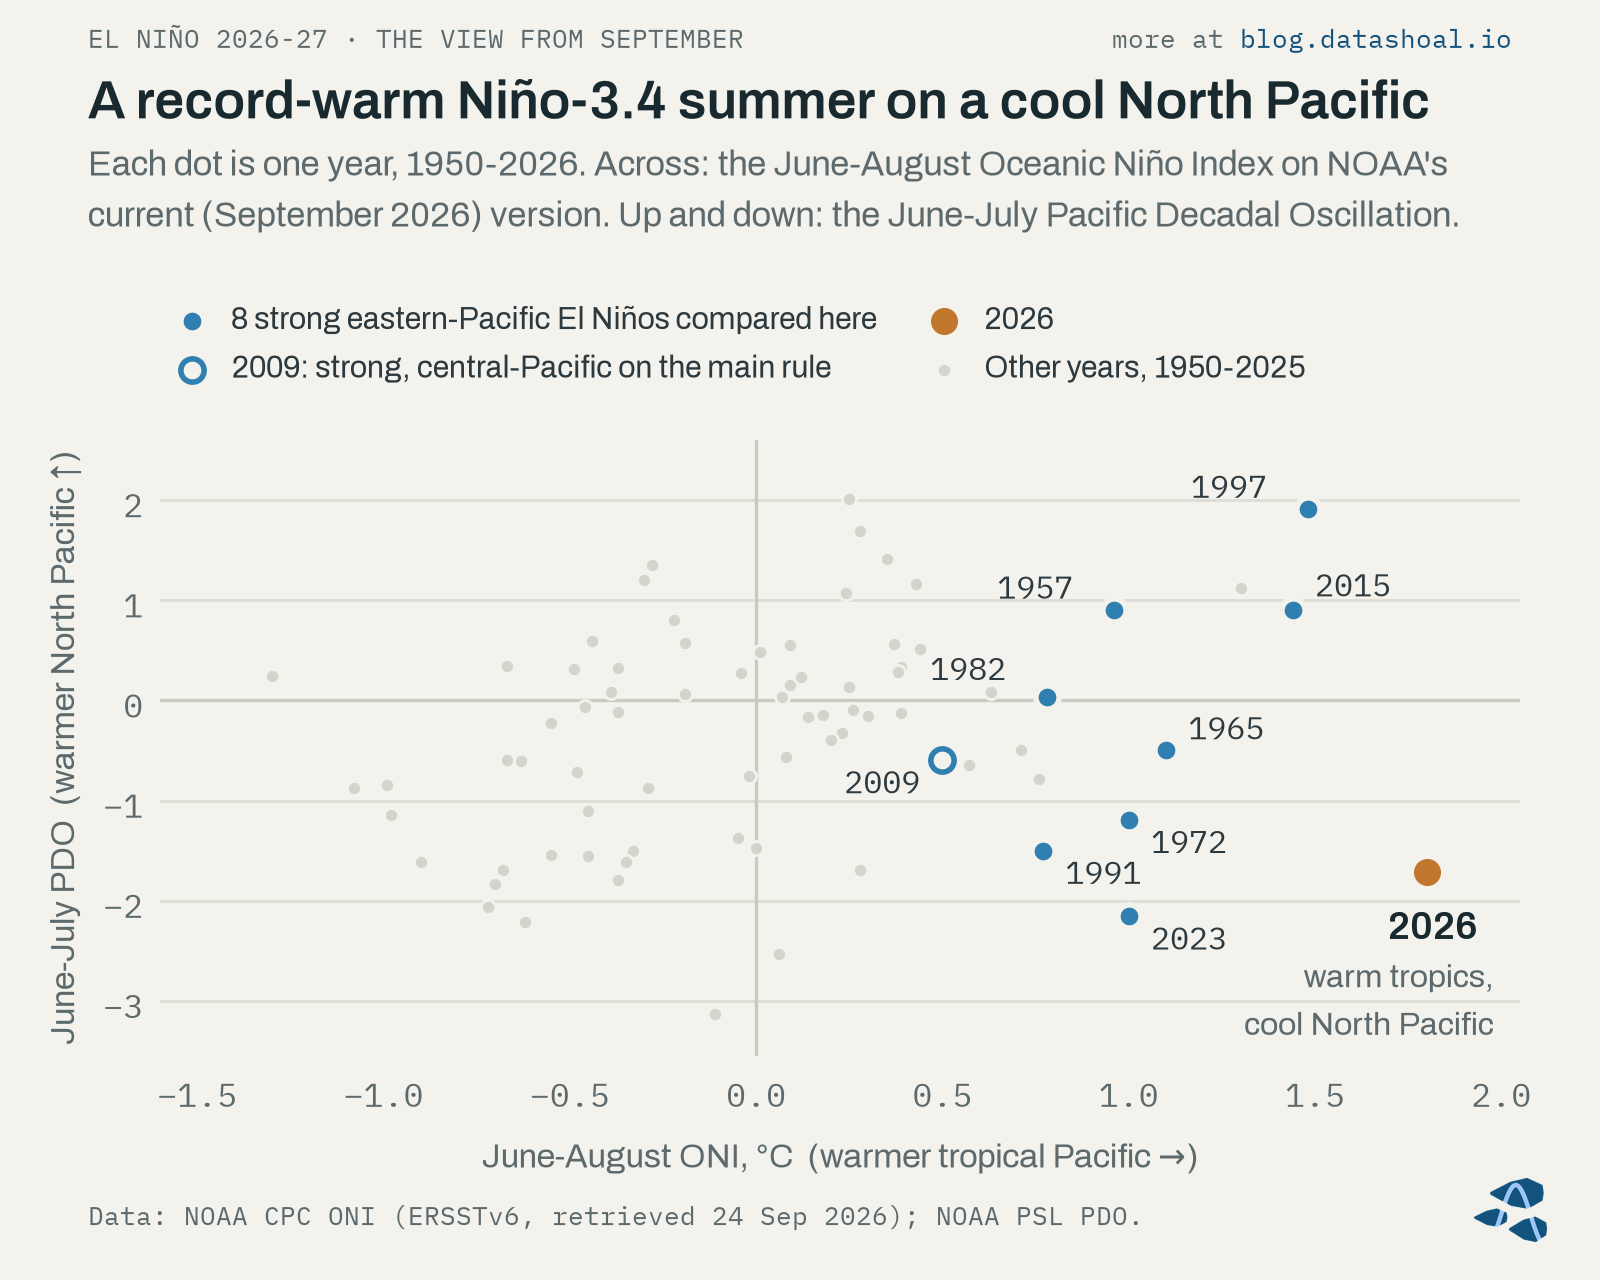
The tropics are only half the picture. The Pacific Decadal Oscillation (PDO) summarizes whether the North Pacific next to North America is running warm or cool, and this summer it ran cool.
The North Pacific is unusually cool: the Pacific Decadal Oscillation averaged −1.72 in June-July (9th percentile of 1950-2025); of the 8 past strong or very strong El Niños compared here, 4 had a negative June-July PDO and only 2023 was colder.
KNOWN · measured.
That pairing matters for one of the best-known links between climate and shellfish toxins. McKibben and colleagues (2017) tied domoic acid in Oregon razor clams to a warm tropical Pacific together with a warm North Pacific. This year only the first half of that pairing is present, and past strong El Niños on a cool North Pacific are too few in the toxin records we analyzed to test how that link behaves in a year like this one (INFERRED · case study).
When we lined 2026 up against the 8 past strong eastern-Pacific El Niños we compared, on several measures at once, the closest matches came out like this:
Of the 8 past strong or very strong El Niños compared here (strength on NOAA’s September 2026 index), the one whose September looked most like 2026 is 2023, followed by 1972 and 1965, all eastern-Pacific events on a cool June-July North Pacific. The ranking rests mostly on that cool North Pacific (leave it out and 2015 and 1997 come closest), and none of them had tropical warmth this large this early.
INFERRED · case study (8 past events).
No past year matches 2026 on every measure, so we avoid treating this winter as a rerun of 1997-98 or 2015-16.
What the tests found
Each of these gets its own post over the next four weeks, with the charts and the caveats.
- Winter rain. When we applied today’s rainfall closure rules to 75 years of past rainfall, one California growing area, Agua Hedionda Lagoon, stood out in El Niño winters (INFERRED · supported, as rule-implied exposure in a hindcast); that bears on this winter only if it verifies as an El Niño. At the other four growing areas we assessed, the difference did not pass our tests, and the 8 strong eastern-Pacific El Niño winters were close to all or nothing (INFERRED · case study, 8 winters).
- Blooms and toxins. At California’s monitored piers, about a third of Pseudo-nitzschia seriata-group blooms were followed within eight weeks by particulate domoic acid of at least 0.5 ng/mL in seawater (INFERRED · supported, descriptive), and El Niño indices added no detectable forecast skill beyond local ocean state (more below).
- Warm water and sea level. In August 2026, monthly sea level from La Jolla to San Francisco was 8-11 cm above normal, similar to or above August 1997 (KNOWN · measured, not corrected for air pressure). Southern California’s coastal water had its warmest August since 1982 and has been warmer than normal every month since September 2025, a warmth that began during the 2025-26 La Niña (KNOWN · measured). How much of the August record is early El Niño influence has not been determined (UNKNOWABLE from DataShoal’s data · attribution not assessed).
- The year after. Past strong El Niños split on what came next, and whether this one lasts through spring 2027 cannot be known yet (UNKNOWABLE at this issue date · case listing and external forecasts). Historically, the spring of a La Niña that followed an El Niño brought colder, deeper-sourced upwelled water off central California than the spring right after the El Niño (INFERRED · supported, as a physical index, 7 events; six of the seven La Niña springs came before 2014). For this event that bears on spring 2028, and only if a La Niña follows.
In DataShoal’s hindcast tests, El Niño and North Pacific climate indices added no detectable forecast skill beyond local ocean state to 1-8-week forecasts of Pseudo-nitzschia bloom and domoic-acid onsets at California piers; the tests could only have detected gains of about 0.01-0.06 in Brier skill, as large as the local models’ own skill (4 independent El Niño events). No DataShoal model met the early-warning standard, so this outlook is context, not an alarm.
KNOWN · hindcast tests (no detectable gain; low power).
In plain terms, the few past El Niños in the monitoring record were not enough to show whether knowing the El Niño state helps predict a bloom weeks ahead, beyond what the local water was already telling us. That is why this series makes no toxin or closure forecast for 2026-27, and why we keep pointing back to what is measured in and near each bay, week by week.
What we can’t see
DataShoal currently has no access to toxin measurements for the Salish Sea after 1999, and no diarrhetic-shellfish-toxin values.
KNOWN · data gap (not assessed).
Norovirus, oyster heat stress on exposed beds, and trends in oxygen and pH inside the bays were also out of reach with the data we hold (UNKNOWABLE · not assessed). We note where a hazard was not assessed.
Watching the season as it happens
The outlook above was fixed on September 23rd. Since late September we have been recording the season’s data as it arrives at a cadence of one snapshot a week, before we know how the winter turns out, so that next year we can check the outlook against what actually happened without the benefit of hindsight. We plan to report back on the rain in late spring 2027 and on the full outlook in autumn 2027.
The next weekly posts
- Winter rain. What past El Niño winters meant for rain-closure exposure at five California growing areas, and why the late-winter months matter most.
- Phytoplankton blooms and toxins. What the California Current does in an El Niño, why most blooms were not followed by domoic acid at our threshold, and what the pier records show.
- Warm water and high water. Coastal temperature, marine heatwaves near the bays, sea level, and what history says about Vibrio.
- The second act. What past strong El Niños did the following year, and why spring 2028 is on our watch list.
If you farm in Humboldt, Tomales or Morro Bay, our weekly State of the Bay report follows the local measurements this series keeps pointing to. You can read a sample report. Pilot access is open now.
Sources
- McKibben, S. M., et al. (2017). Climatic regulation of the neurotoxin domoic acid. Proceedings of the National Academy of Sciences 114:239-244.
Corrections and data leads welcome
If you grow shellfish, sample the water, or study any of these bays, we’d like to hear from you. Corrections, better data sources, and disagreement with any of these findings are always appreciated!
About this post
Not a closure notice. Harvest closures are regulatory determinations made by the responsible shellfish-safety authority. DataShoal describes conditions; it does not issue, replace, or predict closures. Always confirm current harvest status before harvesting.
Data. Oceanic Niño Index, weekly Niño-3.4 and the ENSO outlook: NOAA Climate Prediction Center (cpc.ncep.noaa.gov). Pacific Decadal Oscillation: NOAA Physical Sciences Laboratory (psl.noaa.gov). Phytoplankton and domoic-acid data from CalHABMAP, the California Harmful Algal Bloom Monitoring and Alert Program, co-sustained by the Southern California Coastal Ocean Observing System (SCCOOS) and the Central and Northern California Ocean Observing System (CeNCOOS) (calhabmap.org). Rainfall: NOAA National Centers for Environmental Information, Global Historical Climatology Network daily records (ncei.noaa.gov), with Iowa Environmental Mesonet airport observations (mesonet.agron.iastate.edu), under the closure rules in CDPH Shellfish Program growing-area management plans (cdph.ca.gov/shellfish). Sea level: NOAA CO-OPS tide gauges (tidesandcurrents.noaa.gov). Coastal water temperature: NOAA OISST v2.1 (psl.noaa.gov). Upwelling indices: NOAA’s Coastal Upwelling Transport Index and Biologically Effective Upwelling Transport Index (oceanview.pfeg.noaa.gov). No provider endorses this post.
How this was written. Written with the assistance of an AI model from DataShoal’s analysis and the sources above, and edited by Austin Maguire.